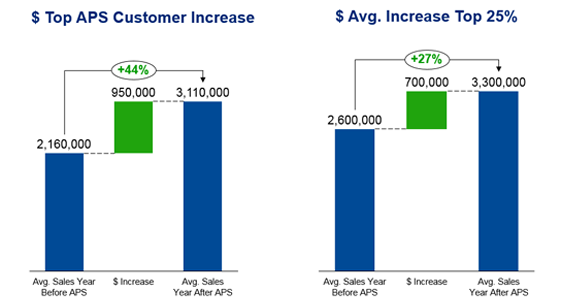
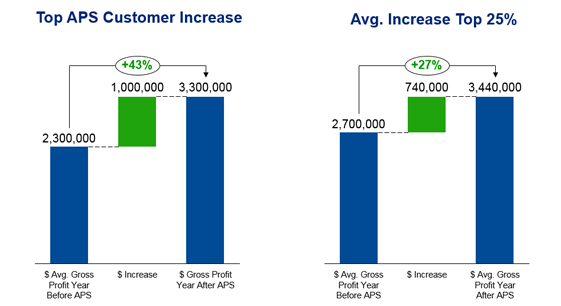
APS By the Numbers
Many businesses that consider Advanced Process Solutions (APS) ask, "What are the typical results?" and "What will the program deliver for me?" Both are great questions! Well, BASF now has a network of repair centers across North America that have implemented APS and the results have been fantastic.
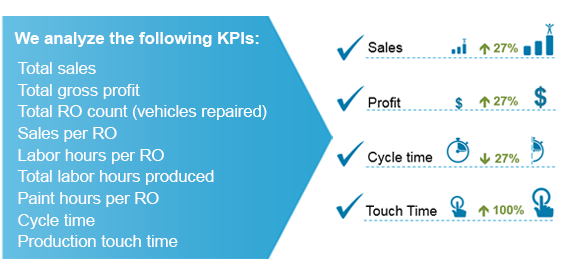
Within this tool, each KPI has a calculator that will provide a measured way for you to see the improvement. We encourage you to enter your actual performance and sales numbers for each KPI listed above. Based on the results from the top 25% of APS shops, we will calculate your expected APS improvement realized after implementing our one of a kind program!

"We just had the highest sales year ever and there was less running around than when we produced half the volume. APS added capacity and we filled it! Everyone is making more money working the same hours and the work environment is much more enjoyable!"
– Joe Townsend, Owner, Dunshee Body and Frame, Kalamazoo MI
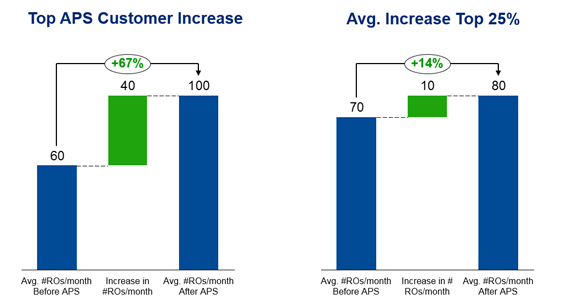
One of the first improvements an APS shop can visibly notice are open stalls ready to produce more work. Available capacity translates directly into increased sales. Why you might ask? Some say:
- The reduced chaos allows the organization to be more customer focused
- The improved performance is quickly recognized and rewarded by current customers and insurers
- Just the ease of doing business attracts more business
The truth is, they are all correct! Most APS shops see an increase in customers from current Direct Repair Program (DRP) relations as well as through the addition of new DRPs.
All drive added sales!

"We have to compete in a market filled with consolidators and there is a big difference between survival and flourishing. BASF's APS program has provided us with standardized systems across several locations and improved our performance allowing us to grow year after year."
– Robert Walne (owner) Herb's Paint and Body, Dallas TX
Gross Profit (GP) is a key component in determining a shop's overall profitability. APS touches many parts of your business, which has a significant impact on Total GP. Personalized APS Standard Operating Procedures (SOPs) result in increased touch time, reduced cycle time, increased paint hours per RO, improved sales and increased labor hours produced, all of which directly relate to an increased GP.

"Our average touch time significantly improved after implementing APS, and shortly after that I added a top 10 insurer to my DRP list!"
– Kurt Johnson, Owner, Cornforth Campbell CARSTAR, Puyallup, WA
Improving top line sales comes from just two places:
1) Increasing the sales per RO (Repair Order -see next page)
2) Repairing more cars.
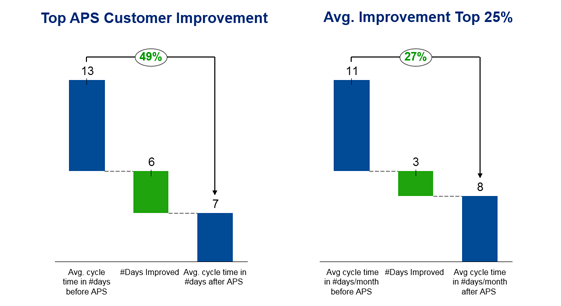
Most APS shops see open capacity due to improved cycle time and touch time, and new Direct Repair Programs (DRPs), i.e. customers quickly follow. In fact, the top 25% of APS shops fix 10 additional cars per month.

"APS processes allow us to maximize the sale on each RO. The added increase in sales per RO improved my total sales without adding more cars."
– Justin Simmons, Owner, Addison Collison Repair Twin Falls, Idaho
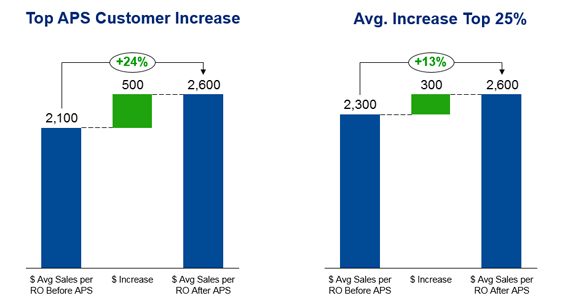
A critical collision repair sales-related KPI is Sales Per RO. Also known as average severity, this KPI helps gauge the sales, repair planning and negotiating skills of the shop. Increasing this number will significantly increase overall total sales. Our top 25% of APS shops see an increase in Sales per RO of $300 in the first few weeks after deployment!
Many attribute this increase to the "100% complete" disassembly process allowing for each operation and part to be accounted for prior to the vehicle entering production. The Disassembly for Repair (DFR) Process sets the tone for effective supplement negotiations and avoids last minute additions that might be overlooked or simply left off the RO due to the pressure to deliver the vehicle.

"We produced over 1,000 labor hours in our second week and our painters produced over 430 hours as a team. (Both well above our average) Three disassembly techs flagged over 100 hours for the week and one; my 80 hour tech; hit 100 hours for the first time. We are producing more hours with less effort and chaos."
– Tom Dys, Body Shop Manager, Shaheen Chevrolet, Lansing, Michigan
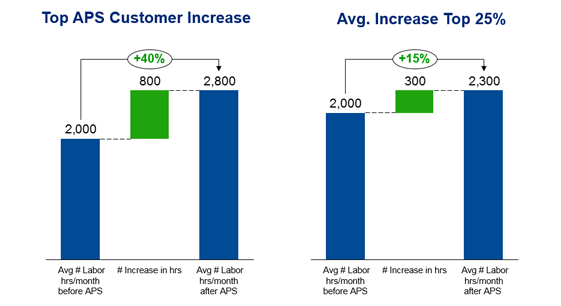
One of the most notable outcomes of APS is producing more labor in the same number of clock hours. In fact, Labor Hours Produced is an important APS measure of success, in both production and sales, right from the onset of the program.
From an APS production perspective, Total Labor Hours Produced (monthly/weekly) is a key measure used to show that your team is meeting or exceeding production targets even though there might be a noticeable lack of chaos in the shop. The APS top performers realize a 13% increase in Labor Hours Produced without an increase in clock hours!

"Having the ability to write an accurate repair plan at the beginning of the repair process allows us to be better negotiate and capture all needed labor operations. One or two hours normally overlooked or discovered late in the process really add up."
– Lorenzo Pellicciotta, Owner, Oakville CARSTAR, Oakville Ontario
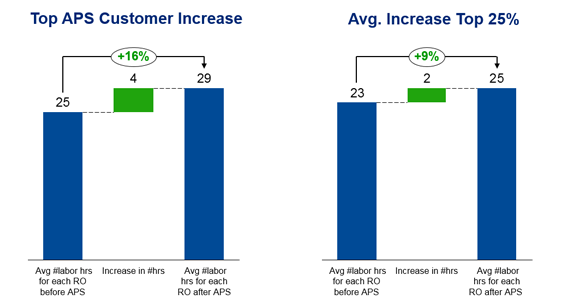
The first place the increased labor hours are noted is in the Average Hours (paint body, frame) Per RO. Increasing this number will increase total sales, total gross profit, overall productivity and technician compensation.
Very similar to total monthly labor (see previous page) and paint hours per RO (see the next page) the average labor hours increase is due to better negotiations, a more complete discovery of damage up front and no labor is given away due to being too late in the process to write a supplement.
On average, APS shops adding one more labor hour on every RO can generate $60,000 or more in sales. Adding one paint hour per RO can add even more. The top 25% of APS performers realized a 15% increase in labor hours produced without an increase in clock hours!

"Maximizing paint sales has always been a priority at LHM collision centers. APS allows us to focus on writing an accurate repair plan and charge for all paint operations - at the front of the repair process."
– Mark Kirk; Director of Collision Center Operations, Larry H. Miller Dealerships, Sandy, Utah
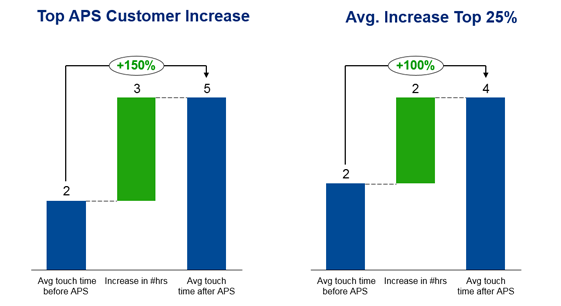
From an APS sales perspective Paint Hours per RO is a key measurement that will increase total sales, total gross profit, overall productivity and technician compensation. Due to a thorough discovery during disassembly, the top 25% of APS shops increase their paint hours Per RO by as much as 14%! Keep in mind, for every additional paint hour sold, paint material sales and profit also increase!
Our team is currently working on developing APS specifically for the paint shop and all processes involved in order to further drive those efficiencies and increase total gross profit.
"After implementing BASF's APS program, we jumped to the top ratings with one of our DRPs, added over 150 points to our index on another and landed another DRP because of the KPI scores that we maintain."
– Luigi Scola, (owner) CARSTAR Scolas, Brookfield, IL
Yes! Cycle time is a highly influential KPI for most insurance company DRP indices. A lower number of repair days can represent a significant reduction in rental costs and overall claim costs. Being a top performer in this category can change the way insurance companies send assignments. Simply stated, those who perform better receive more work and reap tremendous benefits!

"I couldn't walk from one end of the shop floor to the other without being interrupted by three or four people. I was working long hours just to keep up with my business. APS changed everything for the better. Sales are up, the chaos is gone, and I actually have time to work on some of those projects I could never get to."
– Tim Kilkeary, (owner) Kilkeary's Auto Body, Eighty-Four PA
While not necessarily as well-known as cycle time, touch time is arguably the true measure of a shop's overall repair process efficiency.
Without exception, shops that find themselves constantly "fighting fires" have repair processes that are full of interruptions, shifting priorities, reactive supplements, parts issues and heavy customer care issues. The best way to describe the atmosphere: Chaos!
Any shop that has been hit with an influx of work (hail, snow, etc.) knows that as you jam more work into an inefficient repair process, that chaos intensifies. The work day is extended, employee workloads increase, touch times drop even farther, and cash flow issues may surface.
APS delivers improved touch time which opens capacity, facilitates increased sales and improves the quality of life for everyone!
The math is simple:
- If you want to produce 100 hours of labor and have a 2.5 hour touch time, you need to have 40 vehicles in process
- If you can improve your touch time to 5 hours per day, you only need 20 vehicles in process at one time for that same 100 hours
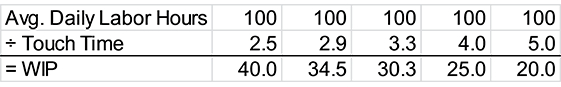
Less vehicles at any one point in time during the repair process translates into less chaos!

Thank you for the taking the time to check out the benefits of APS!
BASF's Advanced Process Solutions are proven to add sales, capacity and efficiency, while maintaining exceptional service levels. We invite you to partner with BASF and experience the APS benefits for yourself.
For more information, contact your BASF business development manager or sales representative.
If you are not currently a BASF customer, and would like to be, please contact:
E-mail: vpol_support@basf.com or
Phone: (800) 238-5237